Abstract's details
Twenty-five years of Mercator ocean reanalysis GLORYS12 at Drake Passage: performance and volume transport.
Event: 2019 Ocean Surface Topography Science Team Meeting
Session: Science II: Large Scale Ocean Circulation Variability and Change
Presentation type: Poster
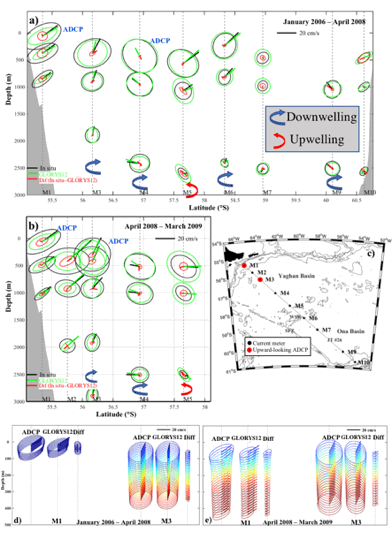
The velocities in the Drake Passage from the 25-year GLORYS12 Mercator Ocean reanalysis were compared with satellite altimetry-derived surface velocities and independent in-situ velocity measurements from the DRAKE (2006-2009) and cDrake (2007-2011) experiments. GLORYS12 model velocities compared well with the current-meter data from the DRAKE (in the water column) and cDrake (at 50 m above seafloor) experiments in terms of means and standard deviations; most correlations between the model-derived and directly measured velocities time series were significant (above 99% confidence level). We then used the model to examine the Antarctic Circumpolar Current (ACC) volume transport across three sections in Drake Passage. The model provides a mean volume transport of 155 3 Sv over the 25 years of the reanalysis (1993-2017) with a mean standard deviation of 6.7 Sv. Annual mean values span over a range of 12 Sv. The DRAKE and cDrake experiments took place in low transport years, with their annual mean transports being smaller than the 25-yearlong average. GLORYS12 transport time series shows significant energy at the intraseasonal, semi-annual and annual periods with no significant low-frequency variation (beyond 2 years) or trend, in agreement with previous studies. This first assessment of GLORYS12 velocities in the Drake Passage is very encouraging and suggests that GLORYS12 can provide further insight into the complex circulation in the Drake Passage at synoptic to interannual time scales.
Figure caption:
Comparison of GLORYS12 to Drake current-meter data.
a) Time-mean velocity vectors and velocity standard deviation ellipses from the current meters, collocated GLORYS12 outputs and the differences in black, green and red respectively from January 2006 to April 2008
b) Same as a) from April 2008 to March 2009.
c) Location of the Drake current meter moorings and upward-looking ADCP (black and red dots). Black dotted line corresponds to Jason ground-track # 104.
d) Time-mean velocity vectors and velocity standard deviation ellipses obtained from the ADCP (M1 and M3), collocated GLORYS12 outputs and the differences from January 2006 to April 2008
e) Same for deployment from April 2008 to March 2009.
A clockwise (anticlockwise) rotation of the mean velocity vector with decreasing depth indicates mean downwelling (upwelling). The bottom topography is indicated in solid gray. Velocity scale is indicated in the upper right corner.

Back to the list of abstractFigure caption:
Comparison of GLORYS12 to Drake current-meter data.
a) Time-mean velocity vectors and velocity standard deviation ellipses from the current meters, collocated GLORYS12 outputs and the differences in black, green and red respectively from January 2006 to April 2008
b) Same as a) from April 2008 to March 2009.
c) Location of the Drake current meter moorings and upward-looking ADCP (black and red dots). Black dotted line corresponds to Jason ground-track # 104.
d) Time-mean velocity vectors and velocity standard deviation ellipses obtained from the ADCP (M1 and M3), collocated GLORYS12 outputs and the differences from January 2006 to April 2008
e) Same for deployment from April 2008 to March 2009.
A clockwise (anticlockwise) rotation of the mean velocity vector with decreasing depth indicates mean downwelling (upwelling). The bottom topography is indicated in solid gray. Velocity scale is indicated in the upper right corner.
