Abstract's details
Visualisation and Analysis of Climate Data in the ESA CCI Toolbox
Event: 2018 Ocean Surface Topography Science Team Meeting
Session: Outreach, Education and Altimetric Data Services
Presentation type: Oral
Climate Change is impacting our lives, tomorrow as well as today. Understanding Climate Change requires data, people, and enabling technologies. The European Space Agency (ESA) is running the Climate Change Initiative (CCI), a 140M€ programme, to provide an adequate, comprehensive, and timely response to the extremely challenging set of requirements for long-term satellite-based products for climate.
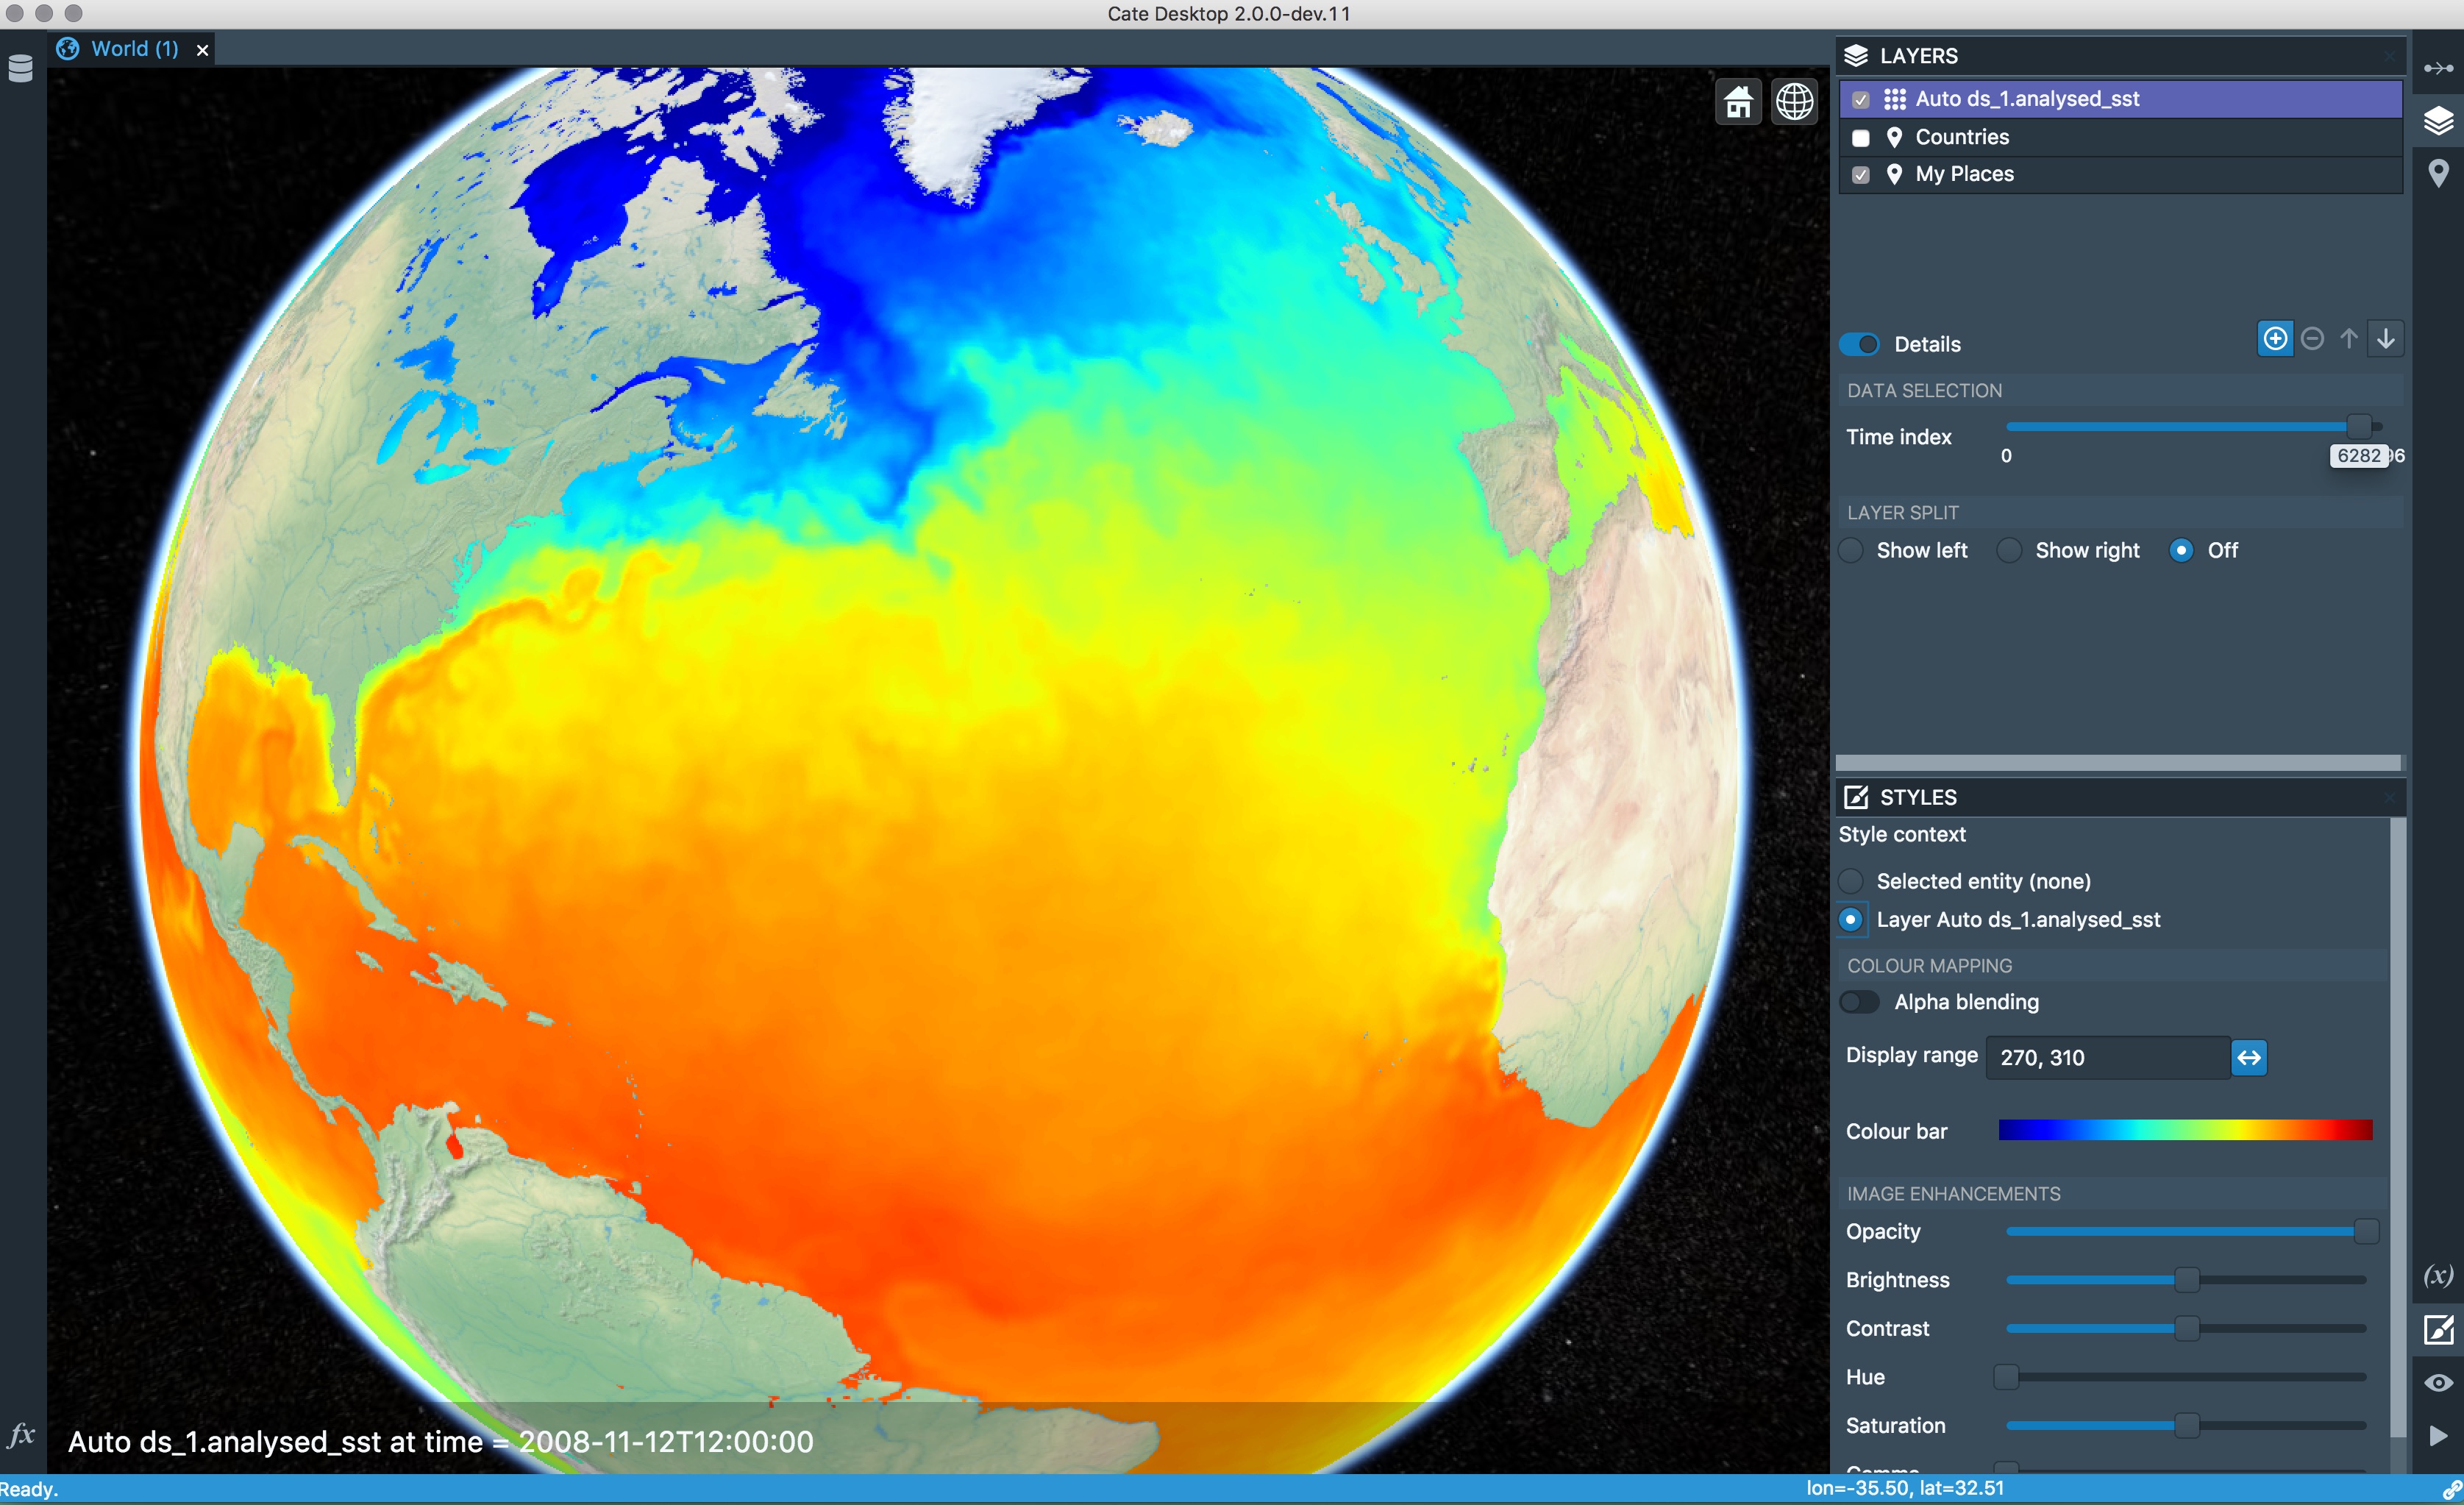
One element of this programme is the CCI Toolbox, CATE, which is an enabling technology connecting scientists, decision makers and the knowledgeable public to climate data. CATE is a software environment for ingesting, operating on and visually analysing all ESA CCI datasets as well as other climate data from various sources, including Sea Level, Ocean Colour and Sea Surface Temperature. The toolbox works by mashing data into a common data model and letting users visualise the results of their investigations in various ways for understanding, knowledge exchange and ideas sharing.
CATE is open source, and its backend operating on the data is fully implemented in python to allow users to modify and extend it. The graphical user interface (GUI) frontend is using web technologies (TypeScript, html5) with powerful visualisation capabilities (React, Blueprint). The GUI is designed as a native desktop application, using Electron technology for the desktop operating system integration. This brings full computing power to CATE operations. The GUI uses a Python (RESTful) web server providing the CCI Toolbox’ WebAPI service to the GUI. The split of backend and frontend with communication via Web Service makes CATE ready for deployment in cloud environments. In addition to the GUI, CATE provides two additional user interfaces for programmatic application, namely a command line interface (CLI) and an application programming interface (API). Workflows can be developed interactively in the GUI, and executed for automation, large batch processing and near-real time processing in these interfaces. All three user interfaces communicate with the Python core via its WebAPI. This design allows for later extensions towards a web application with possibly multiple remote WebAPI services.
In this presentation we will illustrate, with examples drawn from the CCI, how CATE caters for the Sea Level Climate community.
Back to the list of abstractOne element of this programme is the CCI Toolbox, CATE, which is an enabling technology connecting scientists, decision makers and the knowledgeable public to climate data. CATE is a software environment for ingesting, operating on and visually analysing all ESA CCI datasets as well as other climate data from various sources, including Sea Level, Ocean Colour and Sea Surface Temperature. The toolbox works by mashing data into a common data model and letting users visualise the results of their investigations in various ways for understanding, knowledge exchange and ideas sharing.
CATE is open source, and its backend operating on the data is fully implemented in python to allow users to modify and extend it. The graphical user interface (GUI) frontend is using web technologies (TypeScript, html5) with powerful visualisation capabilities (React, Blueprint). The GUI is designed as a native desktop application, using Electron technology for the desktop operating system integration. This brings full computing power to CATE operations. The GUI uses a Python (RESTful) web server providing the CCI Toolbox’ WebAPI service to the GUI. The split of backend and frontend with communication via Web Service makes CATE ready for deployment in cloud environments. In addition to the GUI, CATE provides two additional user interfaces for programmatic application, namely a command line interface (CLI) and an application programming interface (API). Workflows can be developed interactively in the GUI, and executed for automation, large batch processing and near-real time processing in these interfaces. All three user interfaces communicate with the Python core via its WebAPI. This design allows for later extensions towards a web application with possibly multiple remote WebAPI services.
In this presentation we will illustrate, with examples drawn from the CCI, how CATE caters for the Sea Level Climate community.