Abstract's details
The role of the North Atlantic winds in driving the variability of the Arctic Ocean sea level
Event: 2014 Ocean Surface Topography Science Team Meeting
Session: Science Results from Satellite Altimetry: Regional and basin-scale processes and sea level rise
Presentation type: Oral
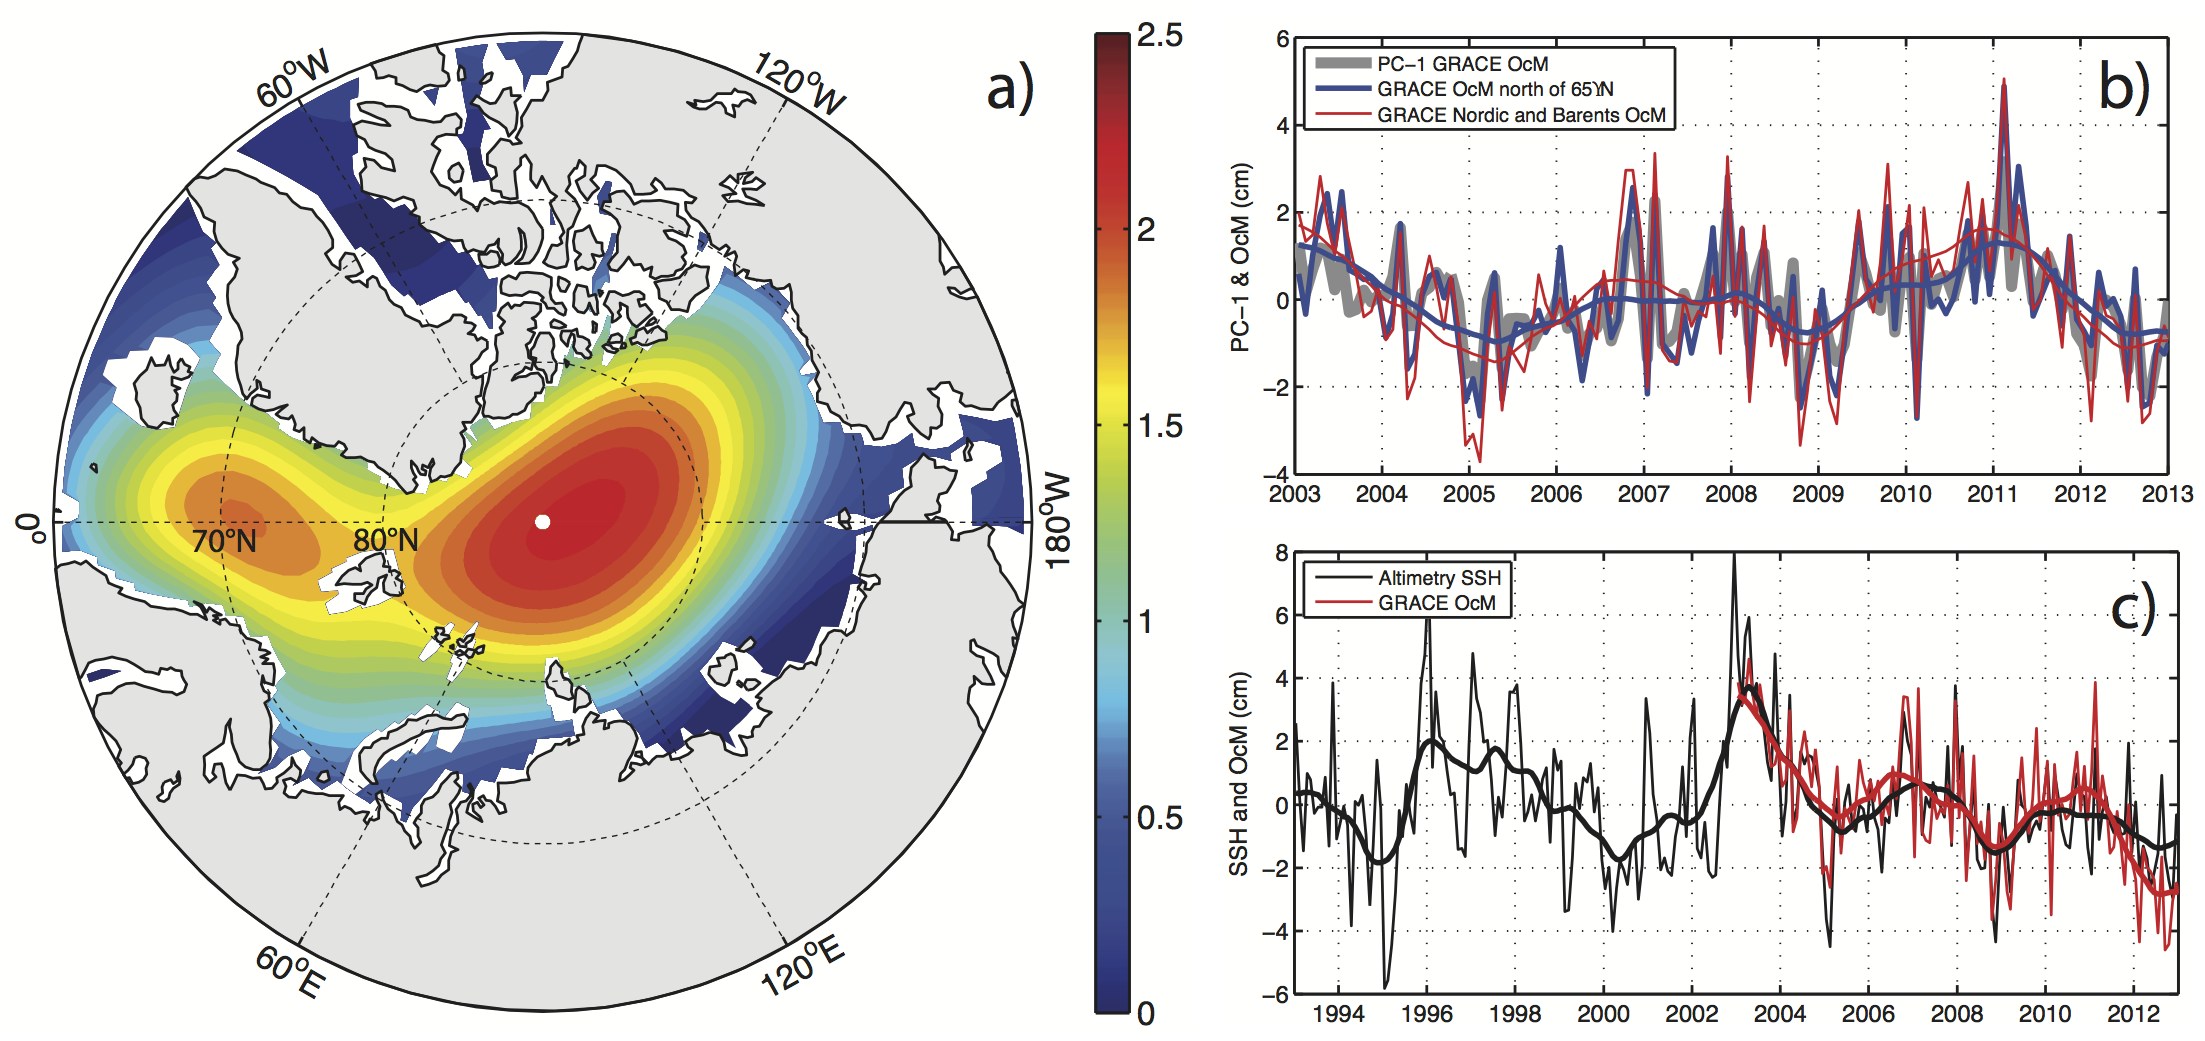
The Gravity Recovery and Climate Experiment (GRACE) satellites have observed coherent and nearly uniform nonseasonal fluctuations of bottom pressure throughout the Arctic Ocean and the Nordic Seas. Strong correlation between the nonseasonal GRACE and satellite altimetry data is found in the Nordic and Barents Seas (see figure), which suggests a possibility of using the longer altimetry records in these areas as a proxy for the nonseasonal sea level variability over the entire Arctic. This study identifies the dominant pattern of the nonseasonal atmospheric pressure variability that drives strong zonal wind anomalies over the northeastern North Atlantic associated with the nonseasonal sea level anomalies in the Nordic Seas. The results of this study show that wind-driven northward Ekman transport anomalies in the northeastern North Atlantic may induce coherent changes of sea level across the entire Arctic Ocean.
Figure 1. (a) The spatial pattern of the first EOF of the nonseasonal ocean mass (OcM) from GRACE shown as a regression map (cm/standard deviation) obtained by projecting the OcM data onto the standardized (divided by standard deviation) first principal component (PC-1) time series. (b) The PC-1 of the nonseasonal OcM (gray curve) and the detrended nonseasonal OcM averaged over the entire Arctic domain (north of 65°N, blue curve) and over the Nordic and Barents Seas (red curve). (c) The nonseasonal sea surface height from satellite altimetry (black curve) and OcM (red curve) averaged over the Nordic and Barents Seas. The interannual changes are shown by yearly running means.

Figure 1. (a) The spatial pattern of the first EOF of the nonseasonal ocean mass (OcM) from GRACE shown as a regression map (cm/standard deviation) obtained by projecting the OcM data onto the standardized (divided by standard deviation) first principal component (PC-1) time series. (b) The PC-1 of the nonseasonal OcM (gray curve) and the detrended nonseasonal OcM averaged over the entire Arctic domain (north of 65°N, blue curve) and over the Nordic and Barents Seas (red curve). (c) The nonseasonal sea surface height from satellite altimetry (black curve) and OcM (red curve) averaged over the Nordic and Barents Seas. The interannual changes are shown by yearly running means.
Contribution: VolkovLanderer_OSTST_29oct2014.pdf (pdf, 6392 ko)
Back to the list of abstract